 Beverley Dormer
1 min read
Benchmarking Banks - what is a good NPS score?
Everyone loves a benchmark, so we scoured the internet (and chatted to some AI) to find NPS scores for banks across the world to use as yardsticks...

I had a teacher who was obsessed with comparing apples to apples. “You can’t compare oranges to apples”, “let's compare apples with apples”, “You wouldn’t compare an apple to a watermelon”. Years later, I got to wondering if she had a past life in survey analytics or if she just had a serious vitamin C and fiber deficiency…
As I’ve delved deeper into the world of Customer Satisfaction analytics, I have seen a raging debate online and I’m sure you have too. “Which scale or point system should I use for my customer experience surveys”?
Reading through some of the views on the topic, brought back flashes of Mrs. Andrews and her apples, and while we're not diving into the debate itself, it may be good to understand rating scales and what the effects can be on your survey.
Typically we use two self-rating scales in a customer feedback survey:
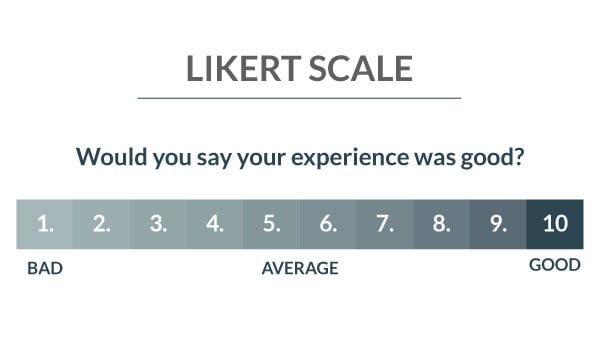
Developed by Rensis Likert in 1932, the scale provides a way to quantify subjective responses on a numerical scale, allowing researchers to analyse and compare individual or group responses.
The Likert Scale consists of a series of statements or items to which respondents are asked to indicate their level of agreement or disagreement. The scale typically ranges from "Strongly Disagree" to "Strongly Agree," with a few intermediate options such as "Disagree," "Neutral," and "Agree" in between (Frequently represented with numbers on a scale of 1: Strongly Disagree to 5: Strongly Agree). Respondents choose the option that best reflects their viewpoint on each statement.
Where you are trying to draw large statistical differences, it’s recommended that you use 20 - 30 statements per Likert Scale when using a matrix-type question, and one should also strongly avoid any statements that could be vague or offer no real stance. It is also useful to offer an odd number of Likert points to allow your customers a middle-ground option, as well as including an absolute zero option.
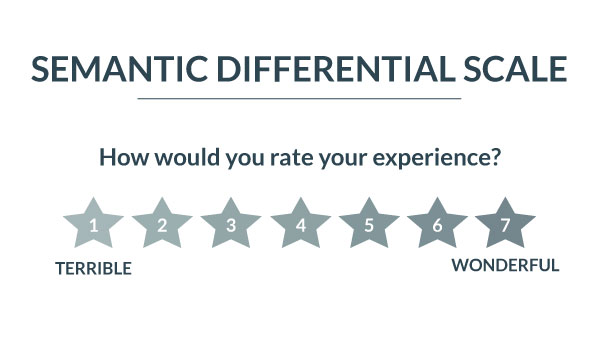
Developed by Charles E. Osgood in 1957, The scale is designed to capture the underlying feelings and attitudes associated with a particular concept using “bipolar” adjective pairs (strongly contrasting statements) that represent opposite meanings and makes use of a 7-point rating.
Respondents are asked to rate the concept or object being evaluated by selecting a point on the scale between the opposing adjectives. The adjectives can range from positive to negative or from one extreme to another (e.g., "happy" to "sad," "good" to "bad," "strong" to "weak").
By collecting responses from a group of participants and analyzing their selections on the scale, researchers can gain insights into the subjective perceptions and emotions associated with the concept. The scale allows for a more nuanced understanding of how people interpret and feel about various ideas, products, or experiences, and is generally considered to have a better basis for calculating median or mean values.
A Likert Scale measures opinion.
A Semantic Differential Scale measures attitude.
The numerical points are thought of as "anchor points" in your survey, the clearer the differences, the easier it is to draw conclusions based on numbers, however, the nuances between these have pros and cons not just for us as the researcher, but for the customer answering the survey.
First to consider is that allowing for less diversity could skew results; your customers don’t always feel the same, and having fewer choices could cause them to lean to one extreme or the other. Likewise, those pressed for time have a likelihood of dropping off after the first few questions and are more likely to do so if you have a complex scale. We know not all scales are equal, some have bias in particular clusters, like the 5-point, or you may only have extremes as found in the 3.
We generally recommend using a rating of 1 - 5 or 1 - 10 throughout your questionnaire. Not only does this allow for some nuance, but it keeps your sale consistent (the same rating throughout), which makes it easier to draw statistics from.
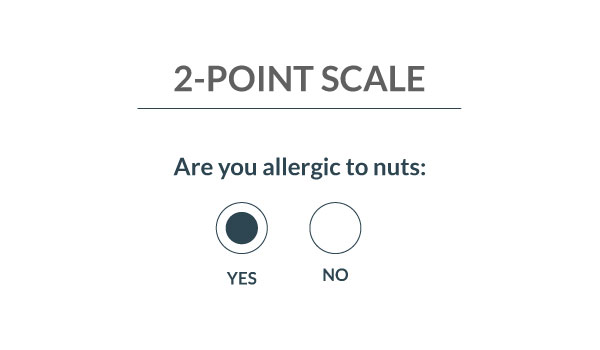
YES or NO, EITHER OR questions. Use these options when you have a choice between two items.
Example:
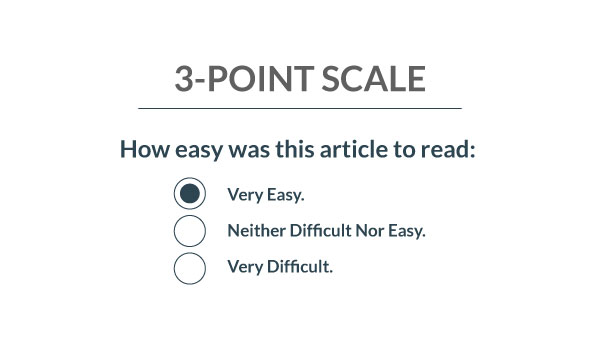
Should be used for an option of extremes for example, and tends to ignore steps beneath the extreme. Use this for instances where you want very clear indicators of performance.
Example:
Ideal for simple surveys where you have a large number of respondents.
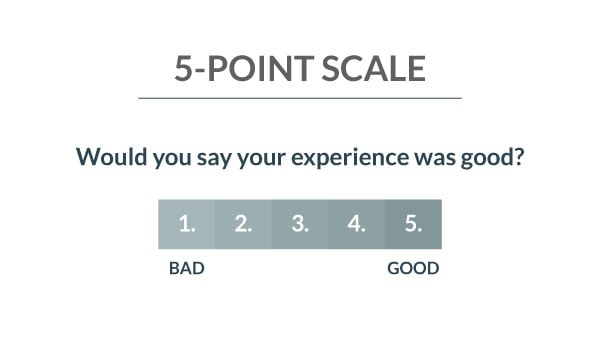
These surveys give a few different options over and above extremes and neutrals and therefore offer you better insight into your customer base. However, note that a 5-point scale can give clustered results, where patterns can be harder to spot.
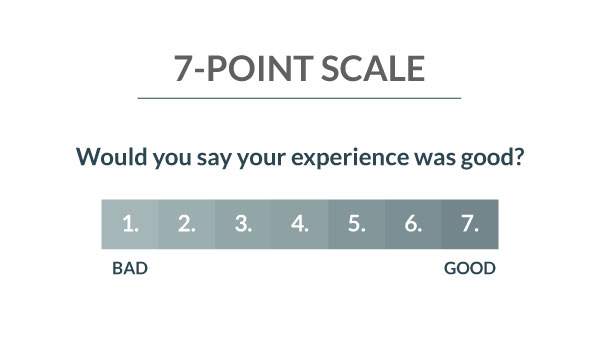
Some call this the sweet spot. Short enough for your respondents to understand, with enough nuance to see patterns and trends throughout your survey.
A 7-point scale offers best results for sentiment and has higher accuracy for analytics. It is worth noting, that the nuance to us may seem huge, but could be negligible to the respondent, and if statements or questions are unclear can suffer from bias in response style.
Offer a much broader range for customers to select from. Use this rating scale where you want nuance and can use follow-up questions to get more insight into the given rating.
Example:
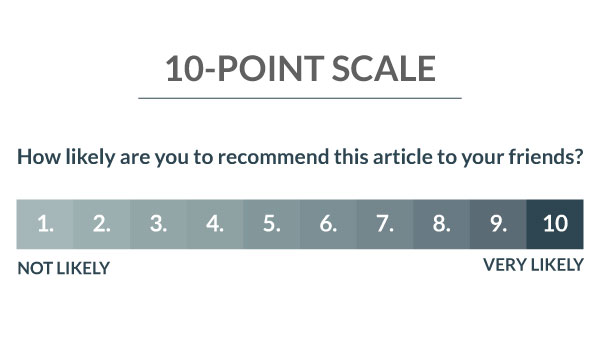
An example of a good follow-up question here, would be: "Please tell us why you gave the rating you did" and allow your respondent to type in a reply.
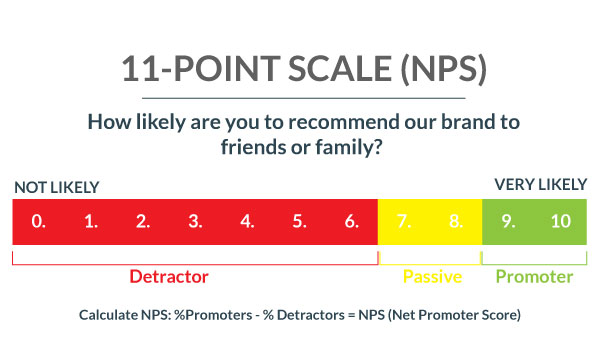
The recognised scale for a standard NPS question, it’s not to be confused with a 10-point survey, as it automatically includes the number 0 in the rating scale.
An NPS score is used to find out who your promoters, passives and detractors are, and who of your customer base are most likely to promote you to friends and family.
All of the information above should give you an idea of the best-use scenario for your scale, but most important to any survey should be the customers you are asking to complete it. By placing them at the heart of every interaction, you’re going to get the best results and the most valuable insight out of your survey.
Not all people are apples, and sometimes our surveys should be a glorious fruit salad, but for the sake of drawing clear comparisons and meaningful statistics, you should decide on your scale ahead of time and keep it throughout the survey.
Need a little help with your survey recipe? Book your demo and see how Smoke CI's Eyerys can create brilliant surveys that get you the answers you really need.

1 min read
Everyone loves a benchmark, so we scoured the internet (and chatted to some AI) to find NPS scores for banks across the world to use as yardsticks...

1 min read
For as long as there are devices and preferences between them, the argument for embedding the first survey question in an email versus including a...

1 min read
Metricising customer service for successful CX